by Emma Fletcher and Jade Kelly and Peter Jones
5 minute read
Last month’s release of the latest local authority recycling statistics for England was an event that stirred little excitement. A small uptick in the household recycling rate was enough to equal the previous high water mark of 43.7%, but represented a sixth successive year of plateauing performance – hardly deserving of high marks when other parts of the UK are advancing so much faster.
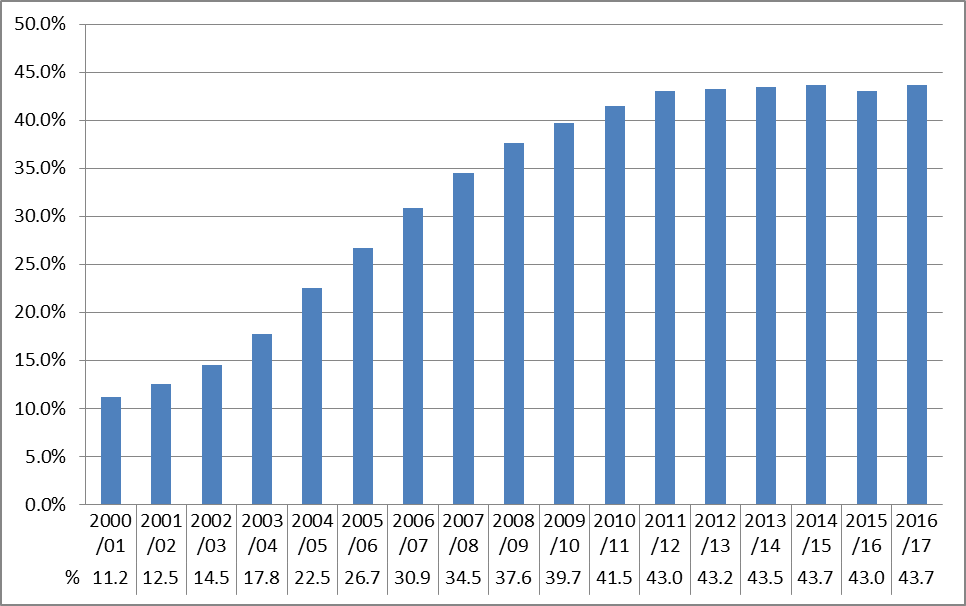
Be still, my chart: there has been no significant change in the household recycling rate achieved in England since 2011. Source: Defra
With just three years’ data to come before the UK reaches the due date for a 50% recycling rate, and England short of concrete policy measures to close the gap, it might seem that the statistics hold little of interest – but delving into the numbers there are some interesting stories to be told.
For one thing, 2016 saw a large increase in separately collected household food waste, some 46,000 tonnes – far greater than in any recent year. There was a similar story for recycling over all, with a year-on-year increase of 254,000 tonnes (2.5%). Total household waste also rose in 2016/17, for the fourth successive year – but just by 0.9%, less than the 1.2% it rose in 2015/16 – restricting the improvement in the overall recycling performance.
Getting a raise
While England over all is stagnating, some areas are bucking the trend. Stroud District Council achieved the biggest increase, a jump of 14 percentage points to 45.5%, after switching to fortnightly residual waste collections in November 2016 and introducing a new food waste service. Similarly, Maldon District Council saw its rate jump by 11 percentage points to 58% when it introduced fortnightly residual waste collections, and replaced sacks with wheeled bins.
Fortnightly residual collections are now commonplace, but it is still early days for authorities putting greater constraints on residual waste through less frequent collections or smaller containers. Once implemented, householders often have space to dispose of little more than one black bag of waste per week. Although three-weekly residual waste collections remain controversial, especially with the media, the potential cost savings associated with these measures mean they are becoming increasingly attractive to cash-strapped councils. But is there any evidence that these measures are effective?
Capacity for change
First, we turn our attention to three-weekly collections. There are only a handful of English authorities that have implemented this collection frequency, and just two have reported a full year of collections.
- Bury was the first authority in England to go three-weekly in October 2014. Its household recycling rate for the first year of full impact (2015/16) was up two percentage points on 2014/15.
- Rochdale made the change in October 2015 and its household recycling rate for the first year of full impact (2015/16) was up 7 points on the previous year. The large jump in comparison to Bury can perhaps be explained by the introduction of a weekly food waste collection service alongside the switch to three-weekly residual. A closer look at the raw data shows that organic waste accounted for the vast majority of the increase in recyclate collected.
How does this compare to nearby authorities that have reduced bin size instead of frequency? Well, perhaps unsurprisingly (given that both systems result in similar reductions in bin capacity) the effects seem to have been relatively similar.
- Tameside reduced the size of its residual bins from 240L to 140L in September 2015; collections remained fortnightly. Its recycling rate increased to 52.8% in 2015/16 (the first full year of impact), up twelve percentage points from 2014/15.
- Bolton took the same step in June 2016, and its rate reached 44.4% in 2016/17, which, despite covering only 9 months, is an increase of 5.3 points over 2015/16.
It appears that the evidence increasingly indicates that both measures can be highly effective in boosting recycling. If England is to reach 50% recycling by 2020, measures as effective as this will need to be implemented by far more authorities.
Flat out reject
While England’s recycling rate has been stagnating, one number has been rising year on year – the level of recycling rejects reported by councils. As predicted on Isonomia in 2016, rejects increased again in 2016/17, although a 25,653 tonne (5.8%) rise in the figure for local authority collected waste represented a considerable slowdown in the rate of growth. Where rejects accounted for 3.9% of recycling in 2015/16, this rose to 4.0% in 2016/17.
The hypothesis advanced to explain the figures was that, rather than reflecting a real increase, much of the growth has reflected improved reporting of rejects, and subsequent articles have reviewed the supporting evidence for this view. The latest numbers continue to show plausible low reject rates amongst authorities that collect kerbside sorted multistream collections; meanwhile the number of authorities that collect some or all of their dry recycling comingled but report very low levels of rejects as decreased.
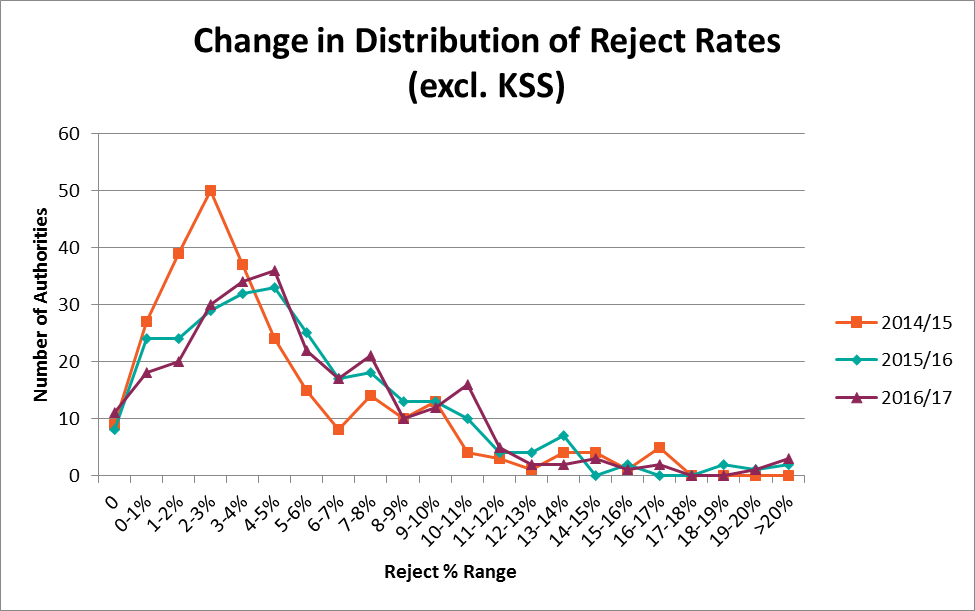
Dealing with rejection: each year, fewer authorities are reporting implausibly low levels of rejects in their mixed recycling. Sources: Eunomia (authority type) and Defra (tonnages)
The number reporting 0-3% rejects has decreased by 46 since 2014/15, while the number reporting 3-10% has grown by 31 – and those reporting 10-15% by 12. Now that the new local authority reporting system under Q100 has largely bedded in, if the theory is correct, we should expect to see the reject rate plateau. That said, there are still a number of authorities reporting unexpectedly low levels of rejects who may yet find it necessary to adopt a different approach to their figures in future years.
Despite the absence of a dramatic overall shift to report from this year’s recycling data, there remains a lot to learn from the numbers. If we want to understand the measures that might be required to make good on the Government’s recent commitment in the 25 Year Environmental Plan to meet “all existing waste targets – including those on landfill, reuse and recycling – and developing ambitious new future targets and milestones”, looking at the success stories in 2016/17 is a good place to start.
Emma Fletcher and Jade Kelly and Peter Jones


Leave A Comment