by Peter Jones
The recent downtick in England’s household recycling rate has led to wailing and gnashing of teeth in some quarters, and something more like gloating in others. However, there has been little examination of what the numbers tell us about what underlies the change, and thus the appropriate policy responses.
The first thing to note is that the drop (from 43.7% in 2014/15 to 43.0% in 2015/16) was small. 2014/15 was a record high, but not by much; the plateauing results mean that last year’s drop returns us to the rate achieved in 2011/12, but there’s actually been very little change either way since then.
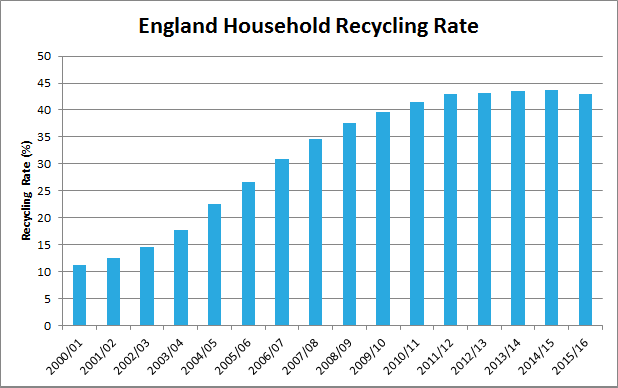
Source: Defra
Interpreting the stats is not straightforward. For starters, while the detailed data is organised in financial years and counts household waste and other local authority collected waste, much of Defra’s commentary looks at calendar years and discusses “waste from households”: these adjusted figures allow consistent comparisons across UK jurisdictions, but don’t match up with the authority-by-authority stats for England.
Rose garden?
Small changes can easily be over-interpreted. Many reports have echoed Defra’s observation in its commentary that organic recycling dropped due to a fall in garden waste arisings between 2014 and 2015, which it seemingly attributed to the weather. Some have suggested that the spread of charged-for garden waste services is a contributing factor. However, comparing 2014/15 with 2015/16, organic waste recycling is actually up 17,000 tonnes (0.4%). Charging for garden waste has been around a while, which makes the picture complex. For example:
- Halton introduced charging in 2015, and organics tonnage went down by almost 4,000 tonnes (17%).
- Kirklees introduced charging in 2011. Last year, it recorded a 4,500 tonne (35%) increase in organic waste collected.
- Medway doesn’t charge (as it mixes food and garden waste), but saw a 3,100 tonne (10%) decrease.
- Organic waste recycling has increased in unitary authorities, but is down in two tier councils.
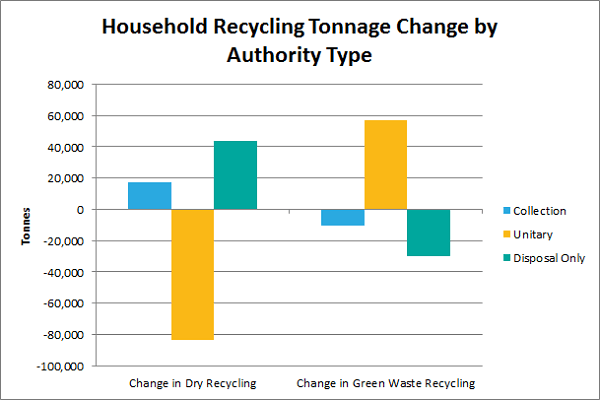
Sources: Eunomia (authority type) and Defra (tonnages)
It’s hard to make a case for a grand narrative about garden waste when the total national change is exceeded by the change recorded by several individual authorities. That said, there would be value in further analysis of the impact of charging, although the significant influence of other variables renders any simple year on year analysis rather suspect.
Other business
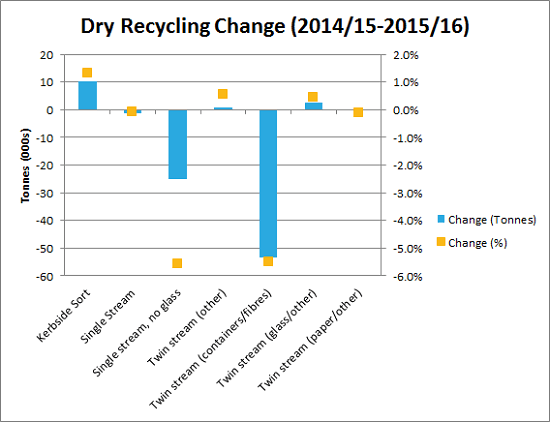
Dry recycling throws up a different set of puzzles. The 2015/16 figures show a 23,000 tonne (0.4%) decrease in household dry recycling, which is the same direction of travel as Defra’s 2015 figure (down 64,000 tonnes, or 1.1%). I haven’t yet rummaged around in the raw data to check which materials are up, and which down – but some simple calculations can be done based on Defra’s waste from households compositional analysis:
| Change (2014-2015)
Tonnes (000s) |
Change (2014-2015)
% |
|
| Glass | 15 | 1.3% |
| Card/Paper | -58 | -2.4% |
| Metal | -4 | -1.7% |
| Plastic | 27 | 6.2% |
| Textiles | 4 | 3.2% |
| WEEE etc | 60 | 12.3% |
| Other | -149 | -14.4% |
Card and paper are down, which might reflect a continuing decline in the use of newsprint. Plastics are up, and so is WEEE. However, the roll-out of WasteDataFlow Q100 means there’s a need for caution about reading too much into small changes in the figures – Defra notes that:
“Since 2015, local authorities have been able to provide more material specific information to report more accurately their waste which would previously have been reported as ‘other materials’”
So the decline in “other” is probably more apparent than real, with much of the tonnage moving to named categories.
Question and answer
It may surprise readers to learn that the decline in the recycling rate is not down to people setting out less material for recycling. In 2015/16, councils actually collected 45,000 tonnes more household material for recycling than ever before. However, of the 10.5m tonnes collected, a record 417,375 tonnes (4.1%) were reported as rejects, up 87,000 tonnes (26%) on the previous year. The increase in reported rejects:
- is double the reported decrease in dry recycling; and
- accounts for 27% of the 322,000 tonne increase in waste that was not recycled.

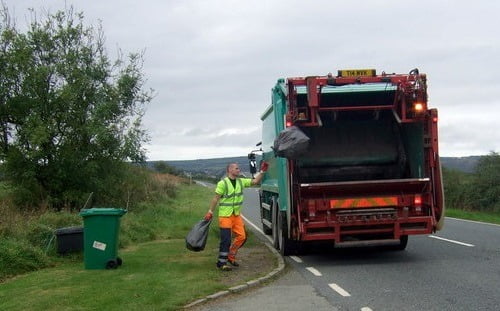
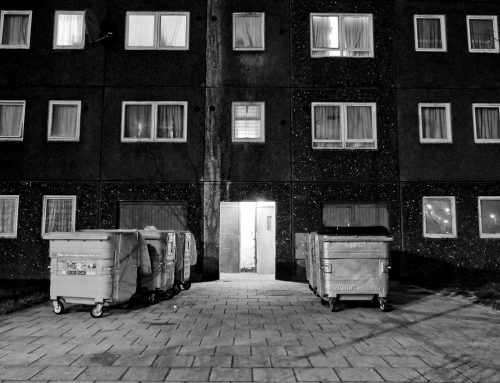
Black bag waste is on the rise in England. Photo: ceridwen (CC BY-SA 2.0), via Wikimedia Commons.
The inexorable rise in the rejects figure has prompted a tremendous amount of press coverage over recent years, not all of it accurate. Many have blamed the change on increasing public confusion, although no clear explanation has been given as to why people have become so much more confused. Back in October, a colleague and I analysed the change in rejects between 2011 and 2015 to see what conclusions could be drawn. There appeared to be several factors at play, but we assessed that most of the increase “occurred across a wide range of councils that formerly had improbably low rejects”. The likeliest explanation appeared to be a piecemeal improvement in data quality from councils that collect recycling comingled.
Data projection
We also noted that many councils were still reporting improbably low figures. In an earlier article we said that, if this theory was correct, the roll-out of Q100 was likely to mean “rejects may remain high and perhaps increase in 2015/16, even if input contamination remains constant or decreases.”
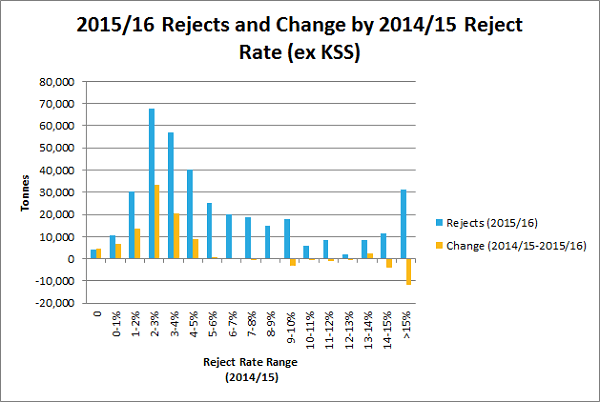
One piece of evidence pointing to the “better data” theory was the decrease in the number of councils that reported improbably low reject figures. If we exclude authorities that use the kerbside sort (KSS) system, and therefore plausibly have very low rejects:
- 43 fewer authorities reported 0-2% rejects in 2014/15 than in 2011/12;
- in 2015/16, the figure dropped by a further 19; and
- the number reporting less than 4% rejects fell by 45.
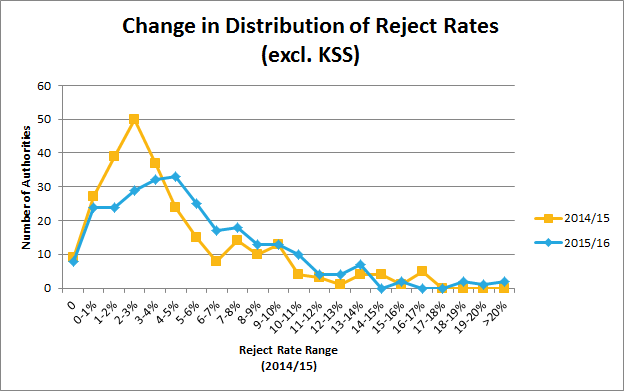
Sources: Eunomia (collection types) and Defra (reject rates)
Equally significantly, it is the councils that previously reported very low levels of rejects that account for most of the change in tonnage, continuing the pattern seen since 2011/12. Authorities that reported a reject rate of less than 3% in 2014/15 showed a 57,776 tonne increase in rejects. Meanwhile, councils that had reject rates above 10% in 2014/15 reported a 15,000 tonne decrease.
Sources: Eunomia (collection types) and Defra (reject rates)
This pattern cannot readily be explained in terms of public confusion. Rather, it suggests that rejects may have been under-reported in previous years (and most likely, remain so). If this is the case, a greater tonnage of household waste may actually have been recycled this year than last!
Some might wonder whether the type of collection system that councils operate has had any bearing on the change in recycling rate. There are differences: overall, kerbside sort systems reported an increase in recycling, as did a couple of less widely used two stream systems, while other systems reported a reduction.
Sources: Eunomia (collection system) and Defra (tonnages)
The results are interesting, but the tonnages involved are small, so I’m cautious about inferring any pattern here.
Questioning the question
2015/16’s recycling rate fall does not appear to be the calamitous reversal that some have presented it as. The tonnage difference between a flat recycling rate and a small fall is not enormous, and when so much has been changing in the way data is collected, it is difficult even to be sure that a real change has occurred. The question “why has the recycling rate fallen?” seems urgent and important – but perhaps we’re getting upset over nothing more than a bit of noise in the data.
It may be more fruitful to regard 2015/16 as a continuation of the pattern we have seen since England’s rate plateaued in 2011/12, after increasing steadily through the 2000s. Then the question becomes, “why is England’s recycling rate no longer rising?” There are many possible answers, but we can usefully ask – “what’s changed since the days of rapid rises?”
- One factor is that councils have fewer staff and a lot less money. In the past, there was greater willingness to invest time in changes that would increase the recycling rate at little or no cost. Now, it’s imperative that changes make savings.
- Another is that the quick wins have largely been made. As a result of improvements made during the 2000s, most councils now offer a pretty comprehensive kerbside collection service. Just 29 rely on bring banks for glass. More don’t collect pots, tubs and trays (90) and cartons (over 100) – but these won’t contribute hugely to tonnage. Only incremental, rather than step changes are now available in terms of materials targeted.
The main measure that pushes up recycling while cutting costs is controversial: reducing residual waste collection frequency. Bury went three-weekly in October 2014, and its rate is up 6 percentage points since 2013/14; Rochdale followed a year later, and is up 7 points since 2014/15. If the task of boosting recycling is left to councils and the current policy framework, it’s hard to see that it can be achieved unless many others follow suit.
While we shouldn’t read too much into the nominal decrease in the recycling rate, it might focus attention on the need for fresh action to boost recycling. Wales’s achievements demonstrate that more can be done within the local authority model, but there is growing recognition that, in order to make progress under current spending constraints, England may need to overcome its aversion to placing more responsibility for managing waste on those who ultimately produce it. If Defra comes to share this view, the tiny fall in the recycling rate might prove to have been significant after all.


This is an interesting discussion. Seems to me the annual changes are so small it may just be normal yearly fluctuations that can be expected when waste diversion flattens out.
I think there are many factors that can influence diversion rates. Lately, I’m starting to think about what our waste stream will look like in future. We have seem continuing changes in waste composition as new products and packaging are introduced. This will likely continue. It is conceivable that our existing infrastructure won’t be as efficient or effective with the composition of waste in the future.
I also give thought to our existing infrastructure becoming maxed out in capacity waste volumes increase. This creates the possibility for excess recyclable or organic materials above the capacity of processing facilities being sent to landfill. In doing so, waste diversion percentages will decline even though the amount diverted remains the same.
Interesting, thanks Peter!
I’m writing an article for our friends at Resource magazine on the state of hld organics in the UK and my basic premise was that it’s not in a good shape – dropping composting and flatlined food waste – based on the Defra commentary but here you suggest this is a distraction from the truth about recycling. How do you get the increase in garden – since it is lumped together as other organics – so comingled food and garden – or have you just spent too long interogating WDF?
Thanks!
Hi Tony, Thanks for your question. The text on garden waste relates to the column labelled “green waste” in the local authority stats. As you say, while the great majority of this is garden waste, it doesn’t disaggregate some other forms of organic waste. I’ve therefore tweaked the text to reflect that there’s a wider range of organics in play. I am in the process of doing some more detailed analysis of WDF Q100, and will write more on the topic when I’ve had the chance to digest it in more detail.
Thanks Peter, I’ve just found the data you used to compare the years and I agree there’s little difference in total organic recycling between the years.
I’d love to have the time to look at the LAs which have switched from co-mingled to separate food and charged garden and see the overall difference in recycling, I guess this is only really possible in unitaries otherwise there’s no way to tell what’s being shifted from kerbside to CA sites.
Also of course, if 1M plus households in the UK are no longer receiving comingled but separate food then that should have seen a small increase in “new” food being recycled nationally, I’d suggest this would only be around 25Kt given how woeful our collection rates are for food!
and of course, everything which is taken over a composter’s or digester’s weighbridge in England is 100% recycled no matter how much plastic and other crap is in there