by Peter Jones and Rob Gillies
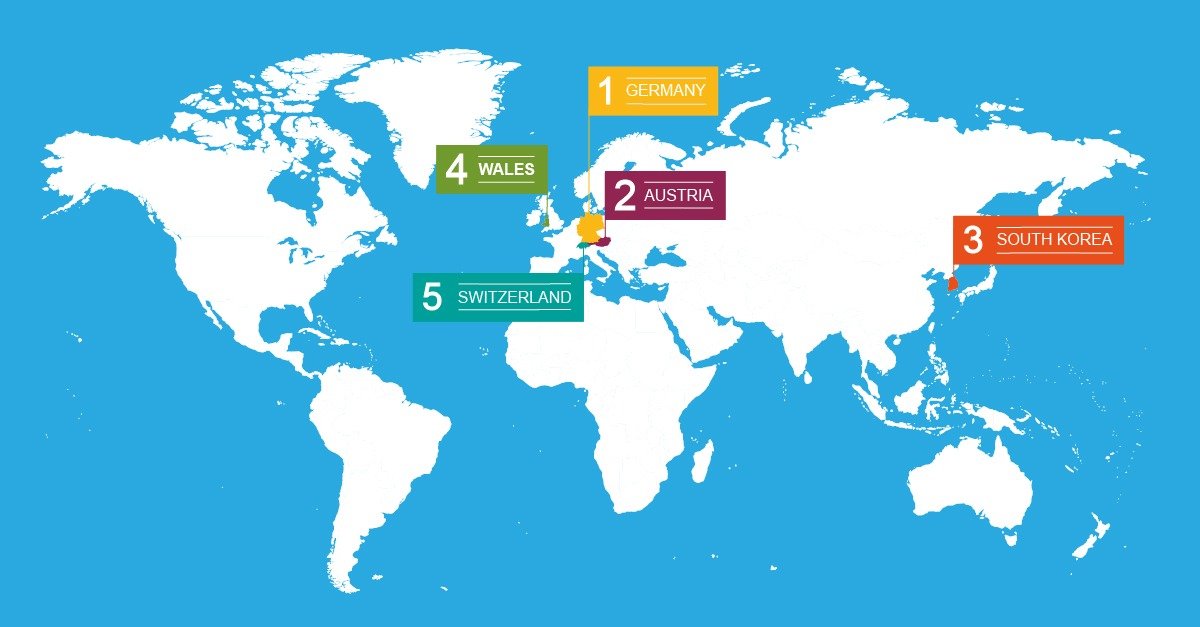
Eunomia recently published the second issue of ‘Recycling – Who Really Leads the World?’, a study that tries to compare on an equal footing the countries that claim the highest recycling rates in the world. It explains why comparing reported recycling rates at face-value is potentially misleading; and by producing more comparable figures, shines a light on those countries that are setting a positive example for others to follow.
The process of developing comparable recycling rates reduces each country’s reported recycling rate. This has led to some commentary suggesting that countries whose rates drop by several percentage points are somehow misreporting their performance. We don’t think that’s an entirely warranted conclusion to draw from the work, as it misinterprets the function that publishing recycling rates has historically played.
Logical deduction
The Eunomia report doesn’t try to judge what is or is not a sensible way to calculate a recycling rate. It makes deductions from reported rates because that is the most practical way to reach a consistent method of calculation. For example:
- Some countries count recycled rubble and other C&D waste from households towards their recycling rate, while others don’t. There may well be such recycling going on, even where it isn’t counted – but in the absence of good data where it is excluded, the only way to reach a consistent figure is to eliminate this material where it is included.
- Countries vary considerably in the amount of non-household waste that is counted in the headline municipal recycling rate. Again, the only way to be consistent is to remove this material from consideration.
- Similarly, material recycled post incineration (metals, ash) are counted in some places, but not in others.
What about considerations such as contamination? Here it could be argued that countries that are less strenuous in their efforts to eliminate non-recyclable contamination from their estimates of how much material is recycled are somehow ‘cheating’, but a lot depends on what you consider the purpose of recycling statistics to be.
Working over time
Early efforts at reuse and recycling tended to be led by producers (e.g. bottlers, looking to recover their bottles) and community groups. They had little interest, and even less ability, to measure and publicly report their efforts into the context of total waste arisings. When recycling started to become more state-led, with kerbside recycling schemes spreading in Europe and the US in the late 1990s and early 2000s, a greater degree of quantification became possible. Along with it came an increased interest in compiling meaningful statistics as a way of measuring progress and comparing it with others.
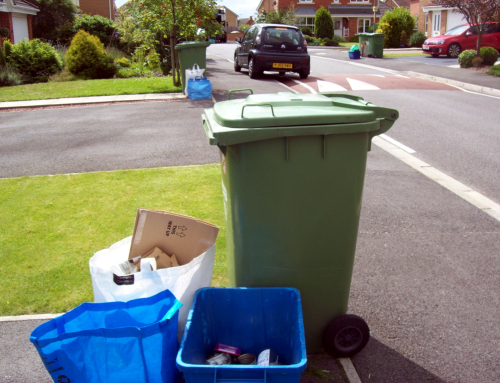
Beyond compare: should we be concerned that it is difficult to compare recycling rates internationally? Image: Eunomia.
Taking the UK as an example, there weren’t consistent local authority figures until WasteDataFlow was introduced in April 2004 – prior to that, I’m told, most data was gathered by telephone, with Defra calling councils up to find out the local situation. WasteDataFlow provided an agreed standard by which recycling was measured, and ensures that all authorities respond; but even now there appear to be some consistency issues – for example, in accounting for rejects. Not all countries have this type of system in place – even the Netherlands, with good green credentials and a headline recycling rate of nearly 57% relies on a survey of local authorities for its numbers, and not all authorities respond.
When recycling targets began to be set, it became necessary for those covered by the targets to be somewhat consistent in how they measured recycling. Even then, recycling statistics weren’t really designed to facilitate international comparisons – even amongst member states of the European Union. Yes, there is a 50% recycling target, but there are four different ways of interpreting it. It can mean 50% of:
- paper, metal, plastic and glass household waste;
- paper, metal, plastic, glass household waste and other single types of household waste or of similar waste from other origins;
- all household waste; or
- all municipal waste.
In addition, there is enough wriggle room in the definitions of key terms to allow a good deal of variation between nations. So, even where recycling statistics are being used to assess compliance with a target, there is no strong expectation of consistency.
System analysis
The absence of uniformity shouldn’t therefore be surprising. The main point of a calculating a recycling rate has historically been, we would say, to enable performance to be tracked year on year and to give a sense of the trend – not to produce perfect figures. Wales, for example, counts some materials towards its recycling rate that other countries don’t, but aims for a far higher target. It isn’t clear that this should be regarded as a problem with its recycling figure – at least insofar as the purpose of the figure is to track progress against its own past performance.
Recycling systems are complex industrial processes involving the public, voluntary groups, businesses and various levels of government. They serve the purpose of making recycling happen – not of generating unimpeachable statistics. It’s far from straightforward for a single entity, such as a local authority, to track its material all the way through the system from collection to final reprocessing.
It is also understandable that most recycling statistics are gathered at the point where it is most convenient, rather than most accurate, to measure. This point will be different from country to country, depending on the recycling systems and processes in place.
Consistently different
Consider the recycling of metals or ash from incinerators – how do you attribute that to the various sources from which the waste originates? Wales solves this by adding this in at the national level, rather than trying to attribute it to individual authorities, while others simply exclude this material from consideration.
Recycling statistics also reflect variations within and between different countries’ recycling practices.
- In the UK, some authorities collect substantial amounts of commercial waste, while others collect little or none, and this material is counted towards the municipal waste total – but is monitored separately from household waste.
- In Slovenia, municipalities collect a good deal of commercial and industrial (C&I) waste and have no means of separating out the non-household tonnage;
- In Austria, commercial waste seems all but absent from the household stream.
- Singapore’s impressive 61% headline recycling rate is largely due to C&I waste; stripping this out takes the rate down to 21%.
- Taiwan, by contrast, has an impressive household recycling rate of over 55%, but if its C&I waste is added in this drops to 28%.
Is there any reason for these very different systems to independently give rise to readily comparable statistics?
While not essential to driving local improvement, it would be useful if there were more uniformity in how recycling is reported – and steps in that direction are being made. Across Europe, the Circular Economy Package will result in amendments to the Waste Framework Directive that will increase recycling targets and remove many of the current reporting ambiguities.
Once the new approach to calculation is adopted in Europe, it may well spread via the OECD to other leading economies, perhaps leading to something approaching a global standard. The results would be of interest, much as Eunomia’s report is – as a way to highlight good practice that can be disseminated. In the meantime, it should be neither mysterious nor surprising that international recycling rates take a good deal of effort to compare: international comparison simply isn’t the job they were designed for.


Pleased to see that CEP is aiming to harmonise reporting of recycling, it is a good first step!
Could this be agreed as a global reporting model? It would be great to be able to balance flows of secondary materials around the World and calculate residual waste against production of secondary materials (I.e. contamination rates and collection/sorting efficiency).
Yes this article is somewhat aiming at the low hanging fruit. Yes all countries measure their recycling rates differently. The UK itself has some weird ways of measuring what is recycled. Simply inferring we are better than you or cheating is an arrogant position to take given the socio-economic differences reflected in the differing capacities and capabilities of each country. This is often taken as western arrogance in developing countries and perhaps (from my point of view) is one of the biggest barriers to progress. See the online Global Waste Management Outlook (2015, 32-33) which summarises some of the main causes.
We also agree with the tenets of the issues herein referenced.
In its very nature Municipal Solid Waste [MSW] is a mixture of materials of which a large fraction of this is Free Water. When you see the vehicles returning from their collection rounds and watching them being weighed both in and out it barely belies credence that they measure gross mass of the wastes collected. This must be wrong since just recently we have had such a large quantity of rain that the changes in recorded mass of waste has been very evident. The corollary to that can be assessed by comparisons with countries elsewhere around the world where they record wide variations of recorded mass of collected waste.
We also agree that adding Commercial and Industrial [C&I] Wastes to MSW is also a fudge and when we saw what was happening in Wales it was evident that this was the issue adopted there.
However there are-again peripheral issues and shortcomings in every area of recording statistics and intentions just as this article attempts to explain.
Why should we – for example – add to the mixture the recycled waste fractions (collected from Municipal Solid Waste) that are dumped in the PRC [Peoples Republic of China] to this array and call that beneficial recycling? This is a total anathema to logic and yet it also adds to the issue! Now that the PRC has at last attempted to control this issue by banning such a practice (good for them!) the waste industry will have to deal with its shoddy attempts to get around the issue with the consequences! This should have been addressed years ago!