by Andy Grant and Peter Jones
The latest flurry of disparagement around the 2014/15 stats on local authority recycling rejects provides an unfortunate reminder that this is a confusing topic. Indeed, it seems it is easy to misunderstand even if, like the Daily Mail and Daily Express, you’ve had it explained to you at length.
The press reports are being addressed through the Independent Press Standards Organisation, but confusion about rejects extends far wider. It’s a function partly of the limited and inconsistent vocabulary we have to describe the problem, and partly of unwarranted assumptions about what causes “rejects”.
The Defra stats do show a substantial increase in the reported amount of local authority rejects; but while an 84% increase since 2011/12, and a 2014/15 figure of 338,000 tonnes of rejected material might sound bad, it’s still barely 3% of the 11 million tonnes of material collected for recycling. For a complex, diversified system that relies on public participation, and which has to deliver material good enough to reprocess, 97% success is quite an impressive result.
Coming to terms
The confusion starts with unclear terminology; so, what are “rejects”, and how do they relate to “contamination”?
- First, people sometimes put the wrong thing in the recycling bin. There are some variations in the materials that are accepted, but items the local council’s system is not set up to handle are contamination.
- There is also “soiling” contamination. Recyclable material like paper can be contaminated with food waste or grease; but while this can have implications for the quality of the final product or the amount of processing required, only in very severe cases will this kind of contamination result in material being rejected at some stage down the line.
If a householder’s bin is very badly contaminated, it may be best just to empty it as residual waste. On the rare occasions when this happens, the waste is added into the residual waste figures, not counted towards recycling rejects.
If a contaminated bin is collected for recycling, there are several possible outcomes.
- The recipient facility will typically have an agreed tolerance level of “input contamination”. Loads that exceed this level may be rejected, although the statistics suggest this rarely happens. These “gate rejects” amounted to only 1,537 tonnes of kerbside-type dry recycling in 2014/15, or 0.01% of material collected for recycling.
- Larger sorting plants (or MRFs) are required to monitor and publish statistics on input contamination in the material they accept.
- Where a load is accepted, the facility will process it. The majority of kerbside recycling is collected in a form that requires some kind of sorting. Material removed during sorting is referred to as “process rejects”, and accounts for around 90% of the 338,000 tonnes.
- Whether manual or mechanical, sorting processes are imperfect.
- Some recyclable material will be rejected erroneously – although there are obvious economic reasons to keep this to a minimum.
- Some non-recyclable material will end up in the sorted recycling; and where recycling is collected mixed, some recyclable material may end up in the wrong output stream. This results in “output contamination”, which is also measured and reported by MRFs.
Some materials – especially plastics and paper – may be put through several different sorting processes in order to grade them into streams that meet reprocessors’ standards. Reprocessors typically undertake some further sorting as part of their manufacturing process to remove any remaining contamination that could harm their machinery or end product. At each stage, there will be process rejects (some of which may be sent for recycling elsewhere), but analysis of Welsh data indicates that the great majority of rejects are recorded at the MRFs where the initial sorting of mixed material takes place. However, the more sorting stages material has been through, the harder it is to attribute rejects to a particular local authority source.
Confusing the issue
Now we can examine the question the press should have been asking: why has the “process rejects” figure gone up by 154,000 tonnes in three years? The newspapers assume that the cause must be increasing public confusion. However, a great many things have changed since 2011, any of which might be contributing factors.
There are some reasons to think that confusion might have increased. Faced with budget cuts, councils have reduced the amount they spend on communication. There is always a case for making things clearer for the public, but it seems improbable that receiving fewer council leaflets should have had such a rapid and marked effect.
One point that the newspapers don’t stress is that councils’ enforcement powers regarding household recycling were the subject of frequent negative press and were drastically curtailed by the Deregulation Act 2015. Could the increase in rejects imply that bin fines were effective incentives to recycle properly?
People could be more confused because councils’ collection systems have become more confusing. However, the overall trend in England is generally towards single stream systems, which should be the simplest to understand; and towards accepting materials like tetrapaks and rigid plastic packaging that might have been contamination in the past. In any cases, service changes usually precipitate a flurry of council communications, which should reduce confusion. Indeed, MRF operators tend to be quite positive about the quality of material from areas that have newly converted to co-mingled collections, but find that contamination issues subsequently increase.
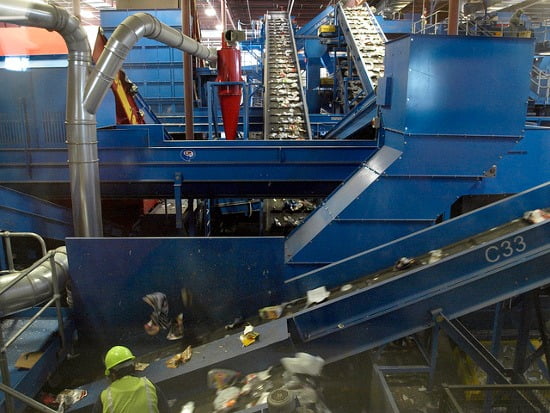
The complexity of the sorting process for mixed materials can be hard to convey. Photo: Gene Spesard (CC BY 2.0), via Flickr.
However, there’s evidence against the “confusion” theory. Generally, the authorities with the highest rejects figures (including those singled out for mention in the news stories) have single stream systems, while “two-stream” systems appear to yield lower contamination. Councils in Greater Manchester, for example, collect paper and card in one container and other mixed recycling in another, doubling the opportunity for people to put something in the wrong bin. There is no hand sorting by council operatives – yet their average reject rate is 3.3%, with the highest at just 5.3%.
So while confusion may be a factor, it doesn’t seem to be the whole story; indeed, whether or not they attract more contamination, the move towards less “confusing” collection systems that require more sorting may be contributing to the rise in rejects.
A good sort
Another theory would be that the additional rejects aren’t due to greater input contamination, but caused by MRFs reducing output contamination. In that case, the increase in reported rejects would be a sign that the end product of councils’ recycling is getting better, not worse. Evidence might include:
- WRAP survey analysis shows that MRF output contamination was a concern for reprocessors back in 2009.
- For several years, the market for recycling has been low. When prices are poor, reprocessors put more pressure on MRFs regarding material quality. MRFs in turn pass on the pressure to councils, raising concerns about input contamination that they may previously have tolerated. When money’s tight, they can’t afford to absorb the cost of dealing with higher than expected levels of non-recyclable contamination, and can’t pass it on down the line as output contamination.
- In 2015, the Waste (England and Wales) Regulations came into effect, and the TEEP test required councils to place a new focus on the quality of their MRF outputs.
- At around the same time, new regulations required MRFs to sample their inputs and outputs, and to publish the results through a WRAP Portal. That has brought more transparency regarding the quality of the material they produce, and may be leading them to work harder to separate out contamination.
However, reprocessors don’t seem to have experienced any uplift in the quality of MRF materials, so there are reasons to be sceptical of this theory, too.
Doing a number on rejects
One final theory is that rejects haven’t really changed, just the figures reported through WasteDataFlow.
- The new WasteDataFlow Question 100 replaces several old ones and aims to improve the quality of reporting on the end destinations of waste.
- Councils have been moving onto Qu100 a few at a time since 2011 (with Wales, as so often, leading the way). Some English authorities began using it during 2014/15, but it only became compulsory for all from April 2015.
- Qu100 makes it easier to report what happens to material that passes through several different processes, including the process rejects that occur at each stage. Preparing to use it also made councils look again at what data they could obtain.
MRF rejects were almost certainly historically underreported – indeed, it wasn’t uncommon in the past for MRF contracts to state that “the contractor shall not reject more than 5%”, regardless of input contamination. We are now moving towards better contracts and more accurate reporting – although the fact that councils still sometimes see dramatic changes in the reported level of contamination when they change MRF contractor suggests there is still progress to be made.
Frankly, no-one knows what is behind the increase in the reject figures. The published Defra statistics cannot help us choose between these theories, although a patient analysis of individual WasteDataFlow returns or WRAP MRF data could shed a little more light on it.
Unfortunately, several of the theories we’ve outlined imply that rejects may remain high and perhaps increase in 2015/16, even if input contamination remains constant or decreases. If so, we’ll probably see newspapers recycling the “contamination/confusion” theory as if it were fact once again in January.


• What factors influence MRF rejects ?
• How can make improvements in both the short and long term to improve MRF rejects ?
So, if 2% is exceptional, where does that leave co-mingled if China and paper reprocessors want standard of 1.5% applied?
Appreciate polishing at secondary run or plant can be done, but that adds to cost!
Some rounds are not sent to MRF
because of high levels of contamination, this waste is not counted as reject at MRF, if it goes direct to MBT, EFW or landfill! But is it still counted as reject or recycling?
Also, charging for garden waste is likely to see an increase in contamination with biomass,, which could kick in next year!
Hi Mike, it’s important to distinguish input contamination from output contamination. A well-functioning MRF could, in principle, produce very pure outputs from input material that has lots of non-recyclable material in it. The MF Regs data gives us some insight into the extent to which this occurs.
When material is rejected at the gate of the MRF, this should be recorded in WasteDataFlow as rejects. The tonnage of such material is very small, and is deducted from the council’s recycling figure (as are all rejects).
The point you raise about garden waste is definitely interesting – one of the big changes potentially affecting recycling figures in 2015/16. We’ll be analysing the data when it comes out in December.
Sometimes people believes to do it well but doesn’t know that is contaminating all the recycle. The problem is the knowledge: people is confused. We should begin to have clear guidelines for an universal recycling behaviour.
Thanks for your comment. I agree that it’s important to have clear guidelines, although the choices made by food packaging manufacturers and variations in what can be processed in different areas make a universal system tricky. However, in the case of England, it seems that there could be other factors at play that might be contributing to the recent increase in rejects.