by Andy Grant and Peter Jones
6 minute read
When we wrote last month about the possible causes of the rise in reported recycling rejects, one of the concerns we raised was that materials recycling facilities (MRFs) have historically underreported rejects. We also highlighted the concerns reprocessors have in the past expressed regarding the quality of MRF outputs.
That leads on to the question of whether, even now, the reject figures fully reflect the issues that arise when mixed material streams are sorted at MRFs. One way to examine this is to ask whether the reported rejects are broadly consistent with the main other relevant data source – the information on input contamination reported by MRFs themselves.
MRFy’s law
Unfortunately, this isn’t a straightforward comparison to carry out. The MRF data presents some challenges:
- MRFs report the amount of contamination found in input and output material, rather than the amount of material rejected during the sorting process.
- The data distinguishes “non-recyclable” contamination (which the specific facility can’t recycle at all) from “non-target” contamination (which is not material the facility wants, but that it can send for recycling – plastic film is a common example). It is unclear whether this distinction is being used consistently, or how well material that is “rejected” – because it isn’t a material the MRF is designed to process – but still sent for recycling is counted.
- Reports are only available on a quarter by quarter basis starting in October 2014, so it isn’t possible to do a full year comparison against the most recent 2014/15 council data.
The Defra recycling data is also problematic. The reported reject figures include organics and waste collected at HWRCs, so in order to focus on the dry recycling that goes through MRFs, you have to examine the underlying data from WasteDataFlow. Even this doesn’t allow you to distinguish perfectly between material collected at the kerbside and similar material collected from bring sites or HWRCs, but any misallocated tonnage should not be enough to affect the results significantly. With these caveats, we can say that approximately 83% of rejects in 2014/15 were of kerbside dry recycling-type material.
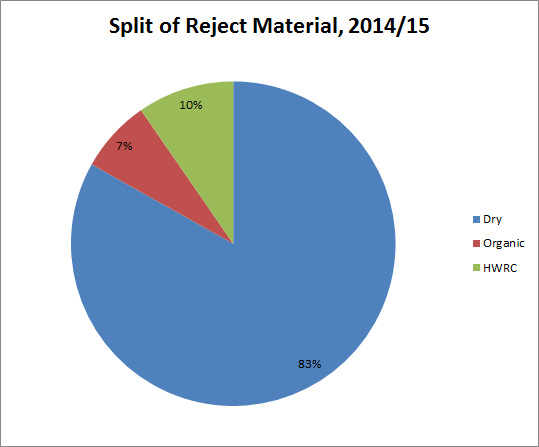
In the following analysis, the “rejects” figure represents only this kerbside dry-type material, expressed as a percentage of the total amount of kerbside dry recycling collected by each authority.
MRF-amatics
Ideally, in a well-performing MRF, all non-recyclable input contamination would be rejected through sorting. The MRF should also separate out and recycle as much non-target contamination as possible. In our experience, MRFs do not have alchemistic properties, and so are unable to turn the ‘base metal’ of input contamination into the gold of target material. Therefore, if the reject figure is smaller than the quantity of non-recyclable input, the only place it can be is in the output material. There it becomes output contamination – which is a bad thing. Of course, even the best MRFs are not perfect and therefore a proportion of target materials will also be lost as rejects.
So unless we’re wrong about the role of alchemy in the sorting process, one would expect that in an ideal MRF, the reject figure should be equal to the non-recyclable input contamination. Practically, in a good performing facility, rejection should in most cases be higher than non-recyclable input.
We decided to look at some of the collection authorities with the top 10 recycling rates in 2014/15 whose collection systems involve a significant share of material being collected commingled, and compare their reported rejects with the available MRF data, which produced the results shown in the chart below.
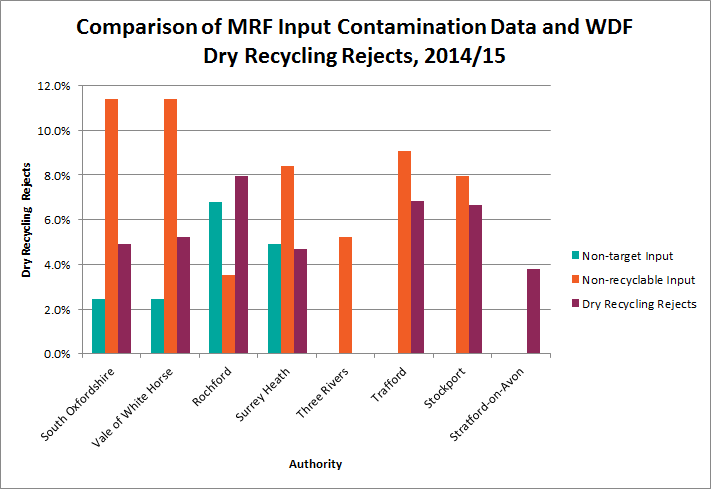
The lack of clear naming conventions on the MRF portal can make it difficult to identify the sources of material. Despite much searching, we were also unable to identify who receives the commingled material Stratford on Avon collects, so we cannot give a MF input contamination figure to sit alongside its 3.8% reject rate.
Sorting the data
There’s not a great deal more information available about Surrey Heath from the MRF Regulations data. Only one quarter’s input contamination data is clearly identifiable, and that for just 558 tonnes of material – mostly paper – delivered to the former Nordic MRF at Tilbury Dock. It’s impossible to draw any conclusions regarding the overall contamination rate of the authority’s dry recycling from such a small sample.
Some transfer stations listed as sources of material in the MRF data receive waste from multiple authorities, which again makes it difficult to identify a contamination figure. Biffa’s Culham transfer station receives fully comingled recycling from both South Oxfordshire and Vale of the White Horse – and, no doubt, some commercial waste too. All of this is shipped on a single input stream to Atlas MRF in Edmonton.
The data therefore doesn’t allow us to make any separate assessment of the authorities input contamination; however, the (slightly different) reject rate reported by the two authorities are less than half of Culham’s average for non-recyclable input contamination. Meanwhile, overall the output of the Atlas MRF over the same period had 1.8% non-recyclable and 3.9% non-target material, indicating that not all of the input contamination was removed.
For a few authorities, it is possible to gain a clearer comparison. Three Rivers Council sent its comingled material to the Pearce Group’s MRF in St Albans, which reported no non-target material in the council’s recycling, but an average of 5.2% non-recyclable input contamination. Nevertheless, Three Rivers reported no recycling rejects for 2014/15.
Trafford and Stockport both collect material in two streams, with paper and card, which would typically account for more than half of dry recycling by weight, separated at source from glass, plastic and metal containers. We only have MRF data for the latter stream, which is sent to the South Manchester Resource Recovery Centre for sorting; the former is presumably baled and shipped to a paper mill.
The MRF “non-recyclable input” figures (9% and 7.9% respectively) therefore relate to half (perhaps less) of the tonnage collected. Meanwhile, all of the dry recycling rejects the councils reported were also of mixed material – the paper and card were collected separately, and under the rules that were in force at the time, only rejects from primary MRFs needed to be reported. So, the overall reject rates (6.8% and 6.7%) seem consistent with the mixed containers being sorted to a high standard. However, it is likely that the figures somewhat overstate the amount of material that is ultimately put to beneficial use.
Rochford is the only one of the top 10 authorities that:
- collects fully comingled recycling;
- has clearly identifiable MRF data; and
- has a reject rate in excess of its non-recyclable input contamination rate.
It reportedly sends its material to Shotton MRF, which has 1.4% non-recyclable and 3.3% non-target output – which could be consistent with all of the other data.
So, where does that leave us? Aside from highlighting the difficulty of extracting much meaningful information from the MRF data regarding local authority recycling, the disparity between the input contamination reported by some MRFs and the rejects reported by the councils that supplied the material is of some concern.
It appears impossible that, in some cases, the input contamination, output contamination and reject data can all be accurate. Alchemical explanations aside, either input contamination is over-reported; or one or both of rejects and output contamination is under-reported. The 2014/15 data cannot tell us which of these possibilities is true; but there is hope that 2015/16 may be better. If used properly, the new WasteDataFlow Q100 should give us a much clearer picture of the amount of recycling that is really put to beneficial use.
Additional research by Ayesha J. Bapasola


Leave A Comment