by Peter Jones
Last month the National Audit Office (NAO) published an assessment of the financial sustainability of English local authorities. Some of the findings were pretty stark, with the NAO reporting that “spending on services has fallen by 19.2% in real terms” since 2010/11, with expenditure on areas other than social care falling by 32.6%. The NAO further stated that:
“A combination of reduced funding and higher demand has meant that a growing number of single-tier and county authorities have not managed within their service budgets and have relied on reserves to balance their books. These trends are not financially sustainable over the medium term.”
Although the total spent on waste collection also fell, one area that bucked the trend was the cost of waste disposal. But as Robin Latchem suggested, the big picture presented in the local authority revenue outturn statistics on which NAO’s report is based contains a wealth of information that bears a bit of analysis.
Metric conversion
In order to present authorities’ expenditure figures on a more consistent basis, I’ve taken the total figures given in the statistics, and combined them with census data to produce a rough cost per household figure. I’ve also applied a GDP deflator to the 2010/11 results so as to express them in 2016/17 terms, so that the expenditure in the two years can be compared more meaningfully. However, I haven’t looked to control for extraneous variables, so the findings should be treated as a starting point for further study.
The box and whisker chart below illustrates the range of 2016/17 costs reported for:
- waste collection, by English waste collection authorities (WCAs);
- waste disposal, by English waste disposal authorities (WDAs); and
- recycling by all English authorities.
It also shows the variation in the way costs have changed since 2010/11.

2016 waste management net expenditure per household per authority and change from 2010/11
The data shows that, taking the country as a whole, the total net cost per household for waste management was £154.07 – a total which includes income from trade waste activity and recycling income. Waste disposal by WDAs (£86.04) is greater cost per household than either the cost of waste collection by WCAs (£38.62) or recycling across all authority types (£26.53) – or indeed, the sum of the two. Focusing on change, the fall in collection costs is evident from the fact that almost the whole of the interquartile range of the change in collection costs is below zero; however the interquartile range for disposal and recycling costs crosses zero, with the median change being very small – a £4.78 increase in disposal costs and a £0 change in recycling costs.
Extreme measures
There are some quite significant outliers: the three authorities with the highest collection costs per household in 2016/17 were:
| Blackpool | £168.88 |
| City of London | £147.55 |
| Hammersmith and Fulham | £133.92 |
It is clear why City of London, with its very small number of households and challenging housing stock with little bin storage and the consequent need for frequent collections, would appear on this list. It’s less clear why Blackpool, with a fairly typical alternate weekly two-stream collection system, should have recorded quite such high waste collection costs – although the council has indicated that it will be bringing collections back in house in order to achieve savings when its current contract ends. It’s also notable that the authority reports recycling costs as less than zero, so it is possible that the costs of collecting both waste and recycling had been included under “waste collection”.
The authority that recorded the highest collection costs in 2010/11, was the Isles of Scilly – another council with a small number of households and very challenging logistics. Scilly does not appear in the 2016/17 figures as the council did not submit a data return in time for inclusion.
At £249.50 per household, City of London is also an outlier on disposal costs – that’s almost £100 more per household than Greater Manchester Waste Disposal Authority (£161.23) and Cornwall (£152.52) , which recorded the next highest costs in 2016/17. However, the City also achieved the biggest reduction in disposal costs per household over the period from 2010/11, when the cost was over £600 per household, indicating a saving over £360 per household, while GMWDA’s expenditure went up by £56 per household. Overall, per household:
- 74% of WCAs showed a reduction in collection costs;
- 39% of WDAs showed a reduction in disposal costs; and
- 48% of authorities showed a reduction in recycling costs, while 12% stayed the same.
Demo-graphics
The data also allows us to examine whether there are interesting variances in cost associated with different collection systems.

Waste collection costs per household per authority of English WCAs split by collection system variables (2016/17)
Unsurprisingly, WCAs that collect residual waste from most households on a weekly basis have higher costs than those where fortnightly collections predominate. Authorities that have adopted three weekly residual waste collections reported substantially lower collection costs – but they remain few in number, and so this finding could be influenced by other factors. Surprisingly, authorities with co-mingled dry recycling collections report higher collection costs than either two stream or multistream councils. Reported collection costs are around £5 per household lower for authorities that operate in house services than for those that outsource collections, although those that have outsourced have reduced their costs by £1 per household more since 2010/11 than have in house collectors. The reasons for this difference are unlikely to be straightforward and would bear closer investigation.
It is also possible to explore the influence that demographic variables have on collection costs.

Waste collection costs per household of English WCAs split by demographic variables (2016/17)
Deprivation appears to have a relatively limited impact on collection costs, but geography appears to be a more significant factor. Urban authorities’ collection costs are £6.50 per household greater than those in mixed areas, and almost £7 more expensive than rural authorities. London authorities have higher costs than urban authorities in general.
Turning to disposal, it appears that the disposal costs of upper tier and joint WDAs are on average greater and have risen more than those of unitaries.
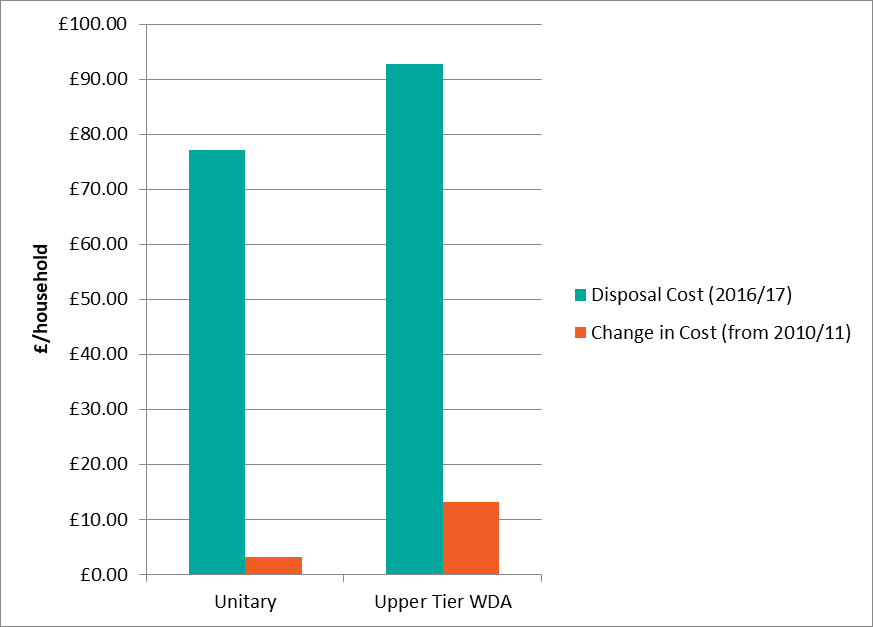
Waste disposal costs per household of English WDAs (2016/17) and change in cost since 2010/11, split between unitary and upper tier/joint authorities.
Finally, the data is sufficiently detailed to enable recycling income to be examined separately from other factors.

Recycling income per household of English local authorities (2016/17) and change in income since 2010/11.
The interquartile range of income per household starts at £0 and extends to £20, with the highest income reported by the City of London (£66.82) and Lichfield (£60.94). The median change in income since 2010/11 is £0, which is due to the significant number of authorities that report £0 income in both years, while the mean change is an increase of £0.96. The biggest increase is Lichfield, which reported no recycling income in 2010/11, while Chiltern’s reported income fell by £72.88 per household across the period.
There is a huge range of ways in which the data can potentially be cut and combined with other sources of information, and in a short blog article I can barely scratch the surface. There are clearly some oddities in the data, with some authorities reporting large, offsetting changes in different elements of their waste management costs, suggesting that some expenditures may have been reclassified. However, the data bears closer examination, and if readers have specific questions about patterns within the numbers, or the performance of particular authorities, I’d be happy to investigate.


“a growing number of single-tier and county authorities have not managed within their service budgets ” Yep, we have seen the results of this. Generally our waste management company is called out to rectify these problems after they have become a huge problem for a long time.
Thanks for the comment, Tony.
Just to clarify, the NAO’s comments concern the sustainability of local authorities’ overall budgets, not specifically their waste management expenditure.
How have council cuts affected your business?
I wonder what the typical cost of a green waste collection is? Currently our authority charges £40 per household per year, and I wonder if that sort of fee is likely to cover the full cost in general, or whether it remains a regressive charge by which flat dwellers are subsidising garden owners, because the true cost is higher.
It’s worth bearing in mind that, while councils have the power under the Controlled Waste Regs 2012 to charge for the collection of garden waste, they’re not obliged to do so. Indeed, not all do. Also, they can only charge for the collection of the material, not for any costs associated with recycling it.
Councils are pretty careful to make sure their garden waste charges don’t exceed what they have the power to charge. £40 is in the right sort of ballpark – around the average for this type of service, according to a recent survey. https://mantis.uk.com/garden-bin-tax-how-does-your-council-compare-2/